Using the Variation of Information
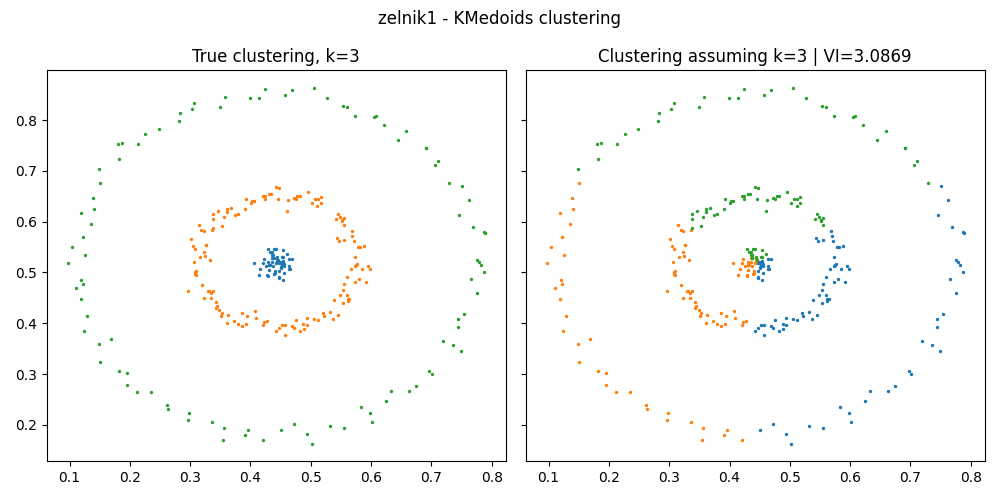
In this example, we compute the variation of information between the true clustering and the clustering predicted when assuming the correct number of clusters. We see that some clusterings methods are not adapted to some dataset and this is illustrated by a high variation of information (VI) between the predicted and the true clustering.
If you wish to run the example scripts on your own computer, please first follow the instructions detailed in Running example scripts on your computer.
from sklearn_extra.cluster import KMedoids
from sklearn.preprocessing import StandardScaler
from pycvi.datasets.benchmark import load_data
from pycvi.cluster import get_clustering
from pycvi.vi import variation_information

from pycvi_examples_utils import plot_true_selected

# Load data
datasets = ["xclara", "zelnik1"]
for dataset in datasets:
    print(f" ============= {dataset} =============")
    data, labels = load_data(dataset, "barton")

    # Data pre-processing
    scaler = StandardScaler()
    X = scaler.fit_transform(data)

    # --- Generate clusters assuming the correct number of clusters ----

    # From predicted cluster-label for each datapoint to a list of
    # datapoints for each cluster.
    clustering_true = get_clustering(labels)
    k_true = len(clustering_true)

    # Generate the clusters assuming the right number of clusters
    # Clustering model to use, could be any sklearn-like clustering class
    model = KMedoids(n_clusters=k_true)
    labels_pred = model.fit_predict(X)
    clustering_pred = get_clustering(labels_pred)

    # ------ variation of information between true and predicted -------

    # Compute the variation of information between the true clustering and
    # the clustering obtained with the method on the dataset.
    vi = variation_information(clustering_true, clustering_pred)
    print(f"Variation of information: {vi}")

    # ---------------------- Summmary fig ------------------------------
    ax_titles = [
        f"True clustering, k={k_true}",
        f"Clustering assuming k={k_true} | VI={vi:.4f}",
    ]
    fig = plot_true_selected(data, clustering_true, clustering_pred, ax_titles)
    fig_title = f"{dataset} - KMedoids clustering"
    fig_name = f"variation_information_KMedoids_{dataset}.png"
    fig.suptitle(fig_title)
    fig.savefig(fig_name)
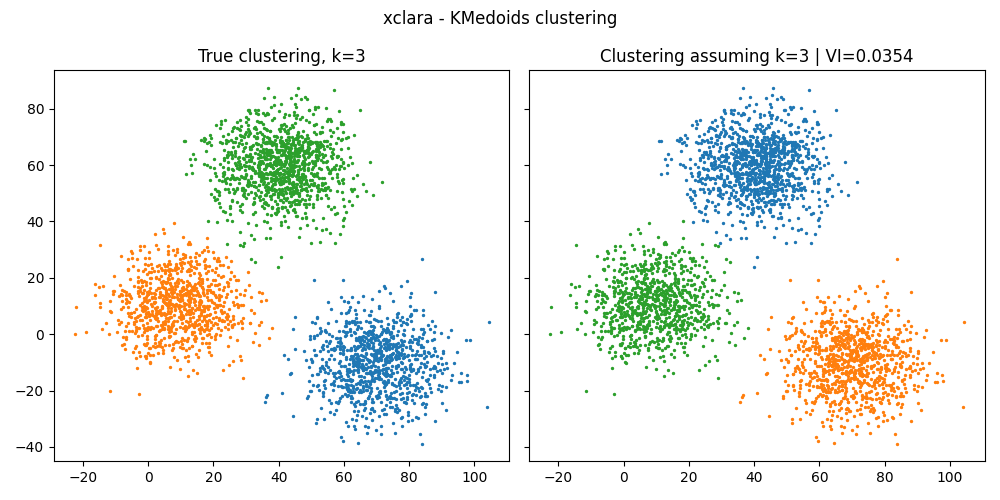
 ============= xclara =============
Source: Barton | Dataset: xclara | Shape: (3000, 2) | Labels: [0 1 2]
Variation of information: 0.035384762841423
 ============= zelnik1 =============
Source: Barton | Dataset: zelnik1 | Shape: (299, 2) | Labels: [0 1 2]
Variation of information: 3.0868601569970346