CVI - Basic usage
In this example, we integrate PyCVI into the usual clustering pipeline in order to select the best clustering.
If you wish to run the example scripts on your own computer, please first follow the instructions detailed in Running example scripts on your computer.
from sklearn.cluster import KMeans
from sklearn.preprocessing import StandardScaler
from pycvi.cvi import Silhouette
from pycvi.datasets.benchmark import load_data
from pycvi.cluster import get_clustering

from pycvi_examples_utils import plot_true_selected

# -------------- Standard data handling operations ---------------------
# Load data
data, labels = load_data("xclara", "barton")

# Data pre-processing
scaler = StandardScaler()
X = scaler.fit_transform(data)
# CVI to use, could be any class defined in pycvi.cvi
cvi = Silhouette()

# ---------- Integrating PyCVI in the clustering pipeline --------------
# ------ 1. Compute CVI values of the generated clusterings ------------
# ------ 2. Select the best clustering according to the CVI ------------

clusterings = {}
cvi_values = {}
k_range = range(2, 10)
for k in k_range:

    # Generate the clusters assuming that there are k clusters
    # Clustering model to use, could be any sklearn-like clustering class
    model = KMeans(n_clusters=k)
    labels_pred = model.fit_predict(X)

    # From predicted cluster-label for each datapoint to a list of
    # datapoints for each cluster.
    clusters_pred = get_clustering(labels_pred)

    # Compute the CVI value of this clustering
    cvi_value = cvi(X, clusters_pred)

    # Store clustering and CVI value
    clusterings[k] = clusters_pred
    cvi_values[k] = cvi_value
    print(f"k={k}  |  CVI value:{cvi_value}")

k_selected = cvi.select(cvi_values)
print(f"k selected: {k_selected}")

# ---------------------- Summmary fig ----------------------------------

clustering_true = get_clustering(labels)
fig = plot_true_selected(data, clustering_true, clusterings[k_selected])
fig_title = "KMeans clustering with Silhouette score"
fig_name = "basic_usage_KMeans_Silhouette.png"
fig.suptitle(fig_title)
fig.savefig(fig_name)
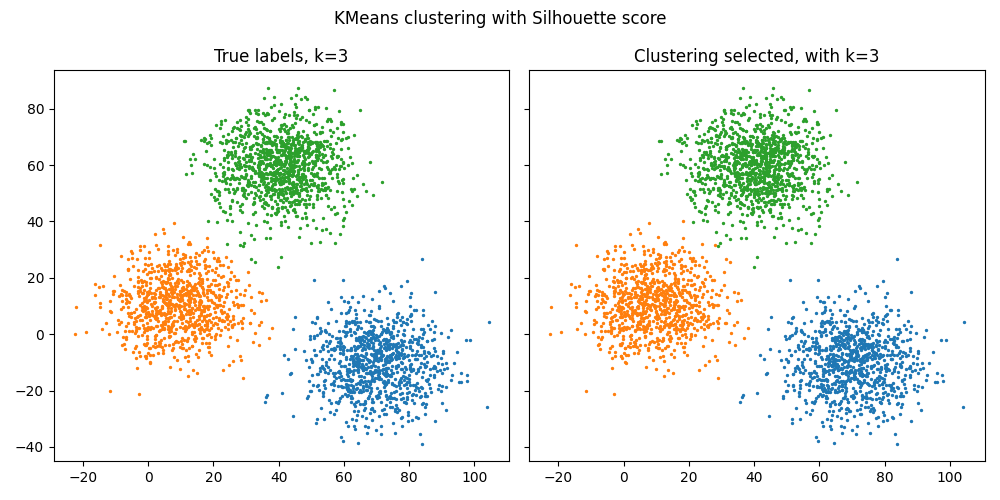
Source: Barton | Dataset: xclara | Shape: (3000, 2) | Labels: [0 1 2]
k=2  |  CVI value:0.6011074539304297
k=3  |  CVI value:0.6918330317974523
k=4  |  CVI value:0.5128413031350835
k=5  |  CVI value:0.4038687350531924
k=6  |  CVI value:0.3474567732440354
k=7  |  CVI value:0.34341354046709094
k=8  |  CVI value:0.33872387097144224
k=9  |  CVI value:0.33740499453394807
k selected: 3