CVIAggregator: Combining CVIs
Here is an example using exclusively PyCVI’s pycvi.cvi.CVIAggregator in order to guess the number of clusters in a dataset. The preprocessing steps and the clustering steps can be integrated into the PyCVI pipeline by providing sklearn-like classes of clustering models (e.g. KMeans) and data preprocessor (e.g. StandardScaler).
In this example, we use non-time-series data, but the syntax would be the same for time-series data.
Here we assume that we are in real conditions, which means that we don’t have access to the true labels (except that we plot the true data for illustrating purpose). We then don’t use the features included in the pycvi.vi module.
This example showcases 2 successful clusterings and clustering selections.
If you wish to run the example scripts on your own computer, please first follow the instructions detailed in Running example scripts on your computer.
import numpy as np
import time
from sklearn.cluster import AgglomerativeClustering
from sklearn_extra.cluster import KMedoids
from sklearn.preprocessing import StandardScaler
from pycvi.cluster import generate_all_clusterings, get_clustering
from pycvi.cvi import (
CVIAggregator, CalinskiHarabasz, GapStatistic, Silhouette, Dunn, XB,
)
from pycvi.compute_scores import compute_all_scores
from pycvi.datasets.benchmark import load_data
from pycvi.exceptions import SelectionError
from pycvi_examples_utils import plot_aggregator
def pipeline(
cvi_aggregator,
X: np.ndarray,
y: np.ndarray,
model_class,
model_kw: dict,
fig_title: str = "",
fig_name: str = "",
k_max: int = 25,
scaler = StandardScaler(),
) -> None:
"""
This function gives an example of typical use of CVIAggregator.
In this example we assume that we are in real conditions, which
means that we don't have access to the true labels tions, which
means that we don't have access to the true labels (except for the
final figure). We then don't use the features included in the
:mod:`pycvi.vi` module. In this function we:
- Standardize the data
- Generate all clusterings for a given range of number of clusters.
- Define a CVIAggregator that will use all CVI available in PyCVI.
- Compute CVI values using CVIAggregator
- Select the best clustering according the CVIAggregator, itself
- selecting the best clustering according to a majority vote on the
best clustering according to its individual CVI.
- Create a summary plot containing the true clustering, the selected
clustering according to the CVIAggregator and the votes of the
individual CVIs represented by the CVIAggregator.
"""
print(f'\n ***** {fig_title} ***** \n')
k_range = range(k_max)
# ------------------------------------------------------------------
# ------------------ Define true clustering -----------------------
# ------------------------------------------------------------------
# From the label for each datapoint to a list ofdatapoints for each cluster.
# true clusters: List[List[int]]
true_clusters = get_clustering(y)
k_true = len(true_clusters)
# ------------------------------------------------------------------
# ------------------ Generate clusterings -------------------------
# ------------------------------------------------------------------
t_start = time.time()
clusterings = generate_all_clusterings(
X,
model_class,
model_kw=model_kw,
n_clusters_range = k_range,
DTW = False,
scaler=scaler,
)
t_end = time.time()
dt = t_end - t_start
print(f"Clusterings generated in: {dt:.2f}s")
# ------------------------------------------------------------------
# ------------ Compute CVI values and select k ---------------------
# ------------------------------------------------------------------
t_start = time.time()
# Compute CVI values for all clusterings
scores = compute_all_scores(
cvi_aggregator,
X,
clusterings,
DTW=False,
scaler=StandardScaler(),
)
t_end = time.time()
dt = t_end - t_start
print('Code executed in %.2f s' %(dt))
# Select k
try:
k_selected = cvi_aggregator.select(scores)
# If no k could be selected with this CVIAggregator don't do anything...
except SelectionError as e:
k_selected = None
selected_clustering = None
else:
ax_title = (
f'Selected clustering. k={k_selected}, with {cvi_aggregator.votes[k_selected]}/'
+ f'{cvi_aggregator.n_cvis} votes'
)
selected_clustering = clusterings[k_selected]
finally:
print(f"Selected k: {k_selected} | True k: {k_true}")
# ------------------------------------------------------------------
# ----------------------- Summary plot -----------------------------
# ------------------------------------------------------------------
# For each k value, get how many CVIs voted for it (i.e. selected it)
votes = cvi_aggregator.votes
fig = plot_aggregator(X, y, selected_clustering, votes, ax_title)
fig.suptitle(fig_title)
fig.savefig(fig_name + ".png")
# ------------- Using specific CVIs ------------------------
X, y = load_data("diamond9", "barton")
chosen_cvis = [GapStatistic, Silhouette, Dunn, CalinskiHarabasz, XB]
cvi_aggregator = CVIAggregator(chosen_cvis)
model_class = KMedoids
model_kw = {}
fig_title = "KMedoids and CVI aggregator with specific CVIs"
fig_name = "Barton_data_KMedoids-specific_cvis"
pipeline(cvi_aggregator, X, y, model_class, model_kw, fig_title, fig_name)
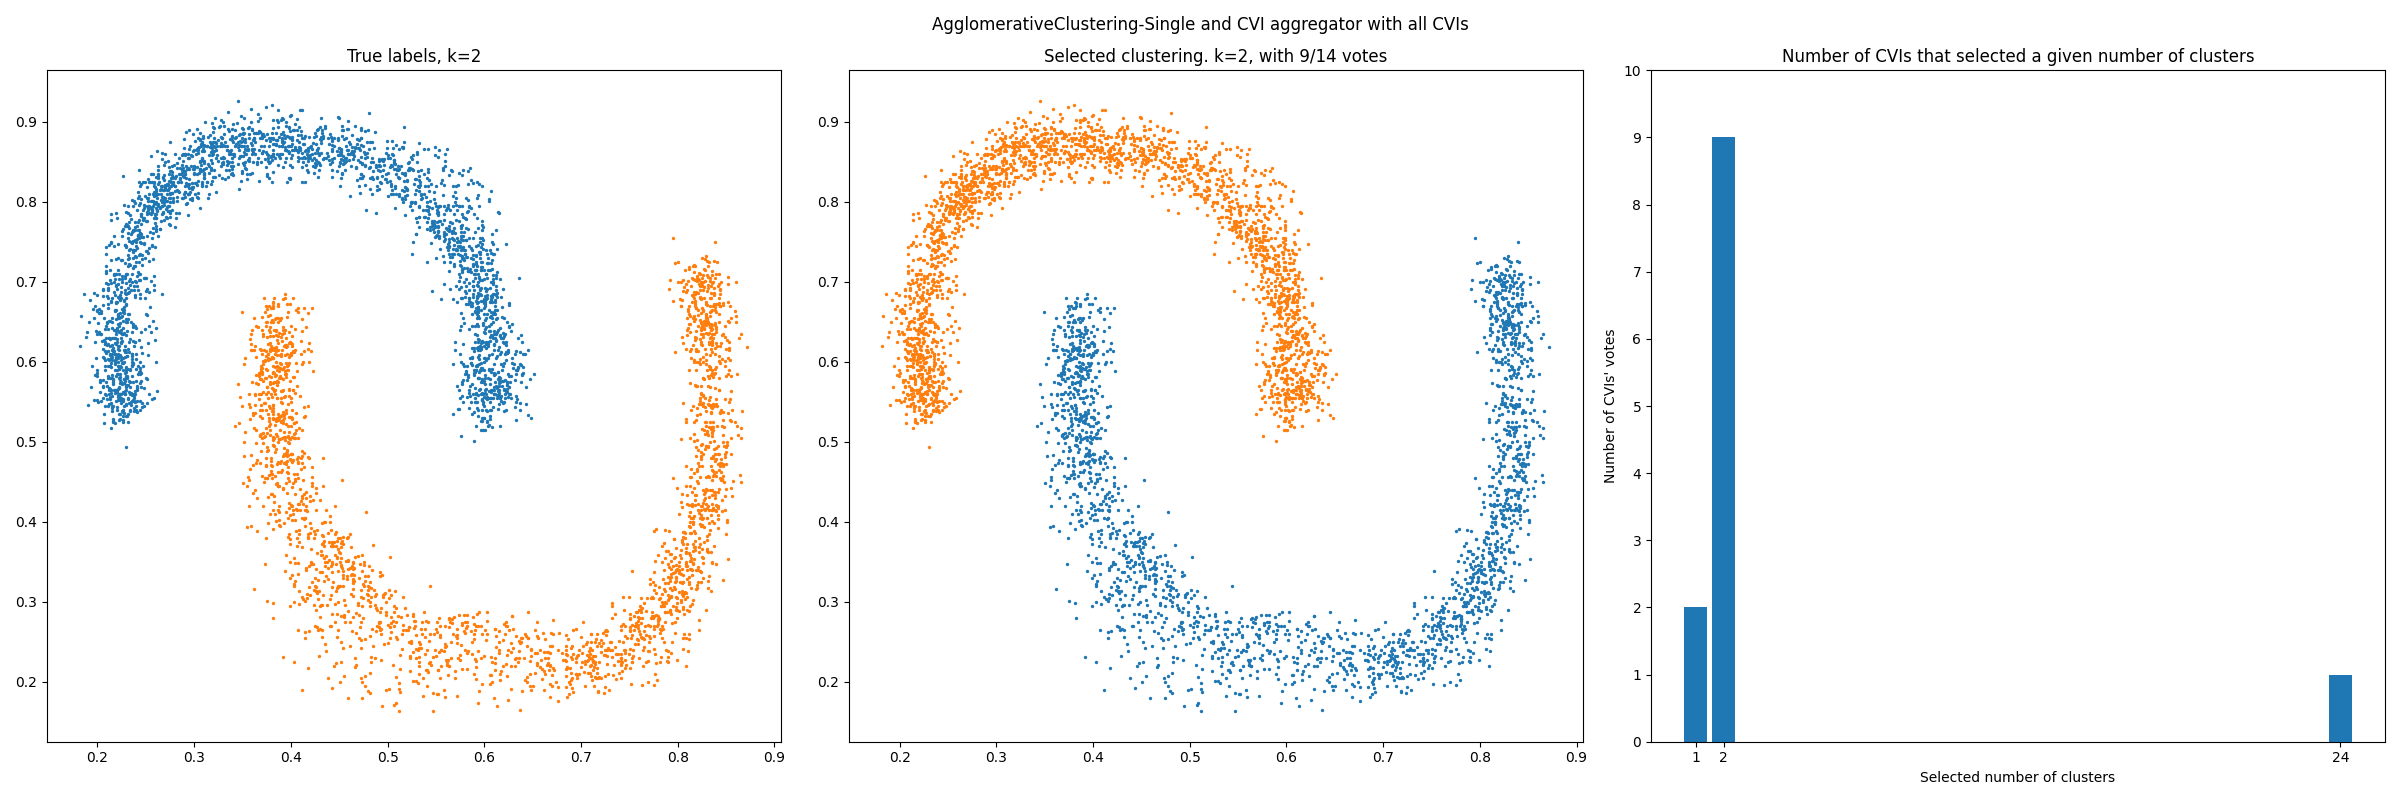
# -------------- Using all CVIs ----------------------------
X, y = load_data("banana", "barton")
cvi_aggregator = CVIAggregator()
model_class = AgglomerativeClustering
# sklearn kwargs for AgglomerativeClustering
model_kw = {"linkage" : "single"}
fig_title = "AgglomerativeClustering-Single and CVI aggregator with all CVIs"
fig_name = "Barton_data_AgglomerativeClustering_Single-all_cvis"
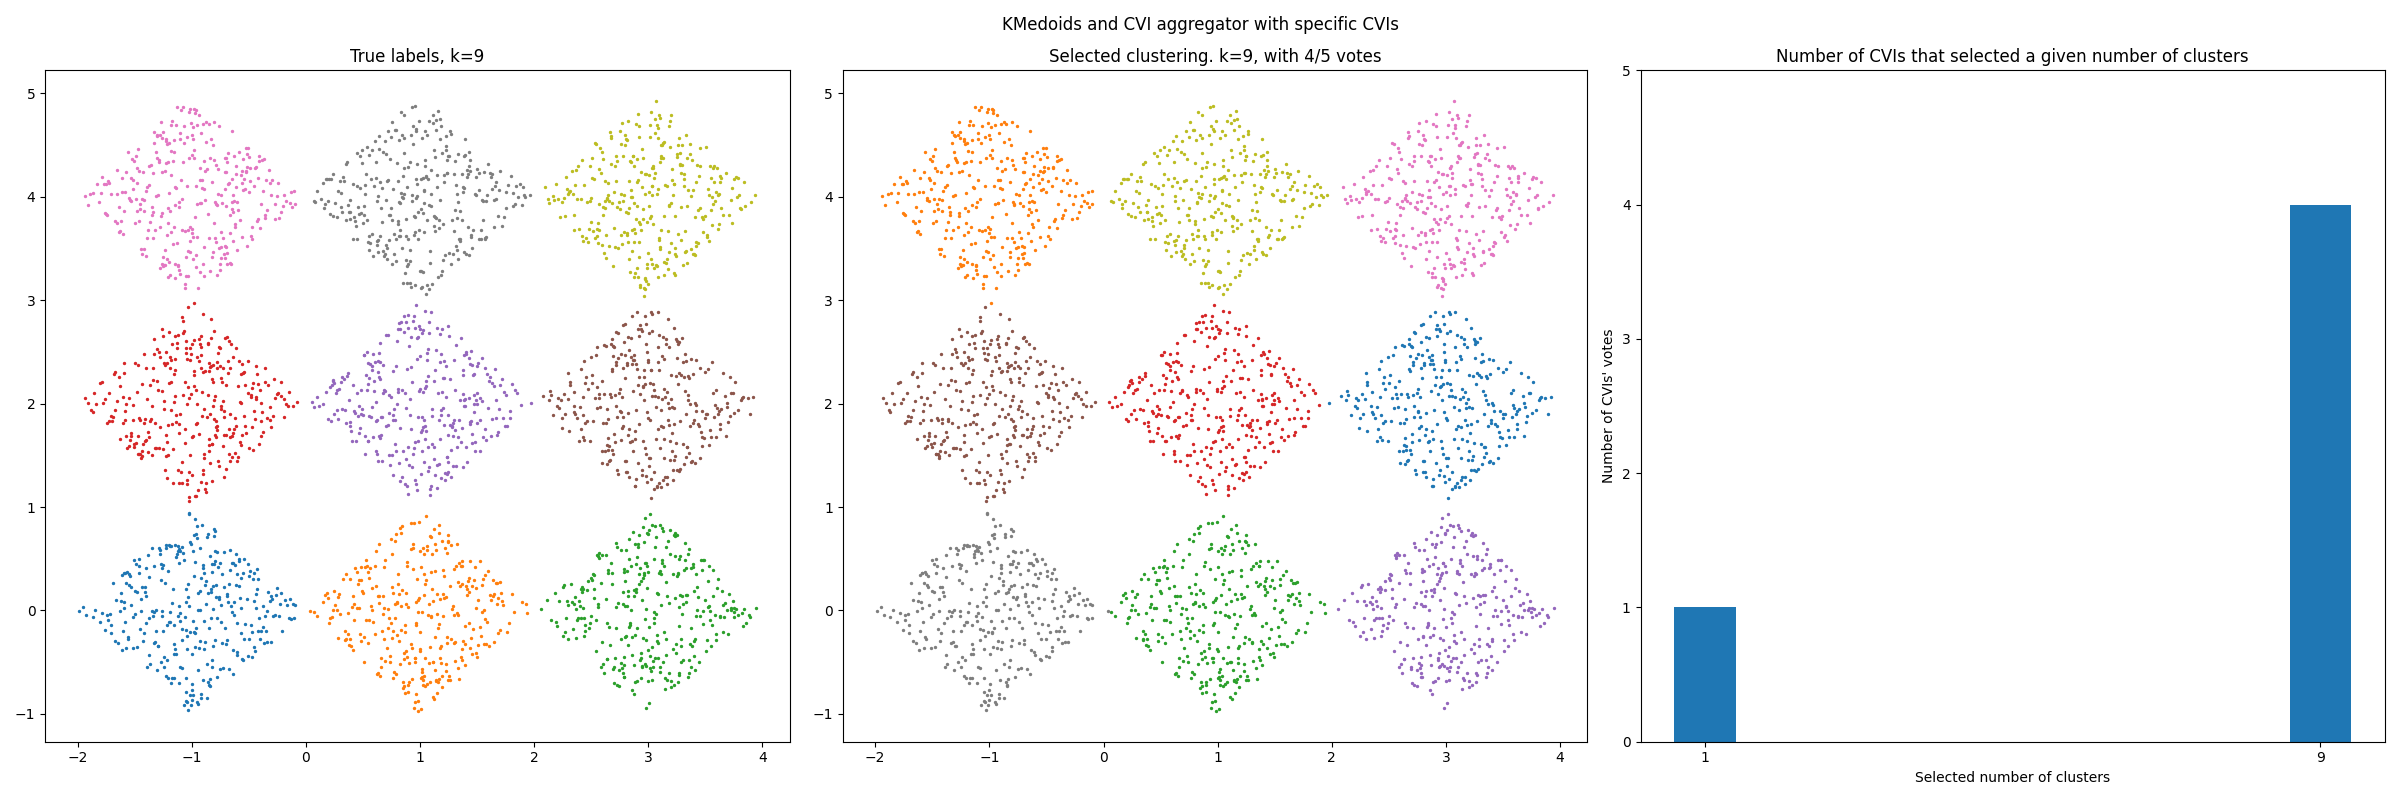
 ***** KMedoids and CVI aggregator with specific CVIs *****

Clusterings generated in: 5.99s
Code executed in 63.83 s
Selected k: 9 | True k: 9

 ***** AgglomerativeClustering-Single and CVI aggregator with all CVIs *****

Clusterings generated in: 2.42s
Code executed in 346.83 s
Selected k: 2 | True k: 2