CVI - Basic usage with time-series
In this example, we integrate PyCVI into the usual clustering pipeline with time series data in order to select the best clustering while using MSM as the distance measure and MBA as the cluster center, specially designed to handle time-series data.
If you wish to run the example scripts on your own computer, please first follow the instructions detailed in Running example scripts on your computer.
 1
 2from aeon.clustering import TimeSeriesKMeans
 3from sklearn.preprocessing import MinMaxScaler
 4from pycvi.cvi import Dunn
 5from pycvi.datasets.benchmark import load_data
 6from pycvi.cluster import get_clustering
 7
 8from pycvi_examples_utils import plot_true_selected
 9
10# -------------- Standard data handling operations ---------------------
11# Load data
12data, labels = load_data("Trace", "ucr")
13(N, T, d) = data.shape
14
15# Data pre-processing
16scaler = MinMaxScaler()
17# Scaling for each variable and not time step wise
18X = scaler.fit_transform(data.reshape(N*T, d)).reshape(N, T, d)
19# CVI to use, could be any class defined in pycvi.cvi
20cvi = Dunn()
21
22# ---------- Integrating PyCVI in the clustering pipeline --------------
23# ------ 1. Compute CVI values of the generated clusterings ------------
24# ------ 2. Select the best clustering according to the CVI ------------
25
26clusterings = {}
27cvi_values = {}
28k_range = range(2, 10)
29for k in k_range:
30
31    # Generate the clusters assuming that there are k clusters
32    # Clustering model to use, could be any sklearn-like clustering class
33    model = TimeSeriesKMeans(n_clusters=k)
34    labels_pred = model.fit_predict(X)
35
36    # From predicted cluster-label for each datapoint to a list of
37    # datapoints for each cluster.
38    clusters_pred = get_clustering(labels_pred)
39
40    # Compute the CVI value of this clustering
41    cvi_value = cvi(X, clusters_pred)
42
43    # Store clustering and CVI value
44    clusterings[k] = clusters_pred
45    cvi_values[k] = cvi_value
46    print(f"k={k}  |  CVI value:{cvi_value}")
47
48k_selected = cvi.select(cvi_values)
49print(f"k selected: {k_selected}")
50
51# ---------------------- Summmary fig ----------------------------------
52
53clustering_true = get_clustering(labels)
54fig = plot_true_selected(data, clustering_true, clusterings[k_selected])
55fig_title = "KMeans clustering with Dunn score"
56fig_name = "basic_usage_TS_KMeans_Dunn.png"
57fig.suptitle(fig_title)
58fig.savefig(fig_name)
59
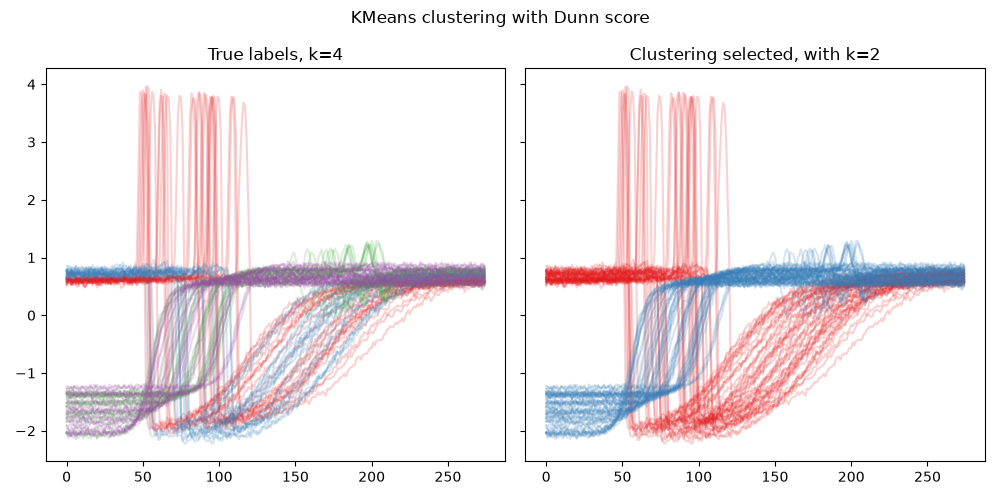
k=2  |  CVI value:0.6221769114650815
k=3  |  CVI value:0.28456695254115594
k=4  |  CVI value:0.06275505651149707
k=5  |  CVI value:0.06936780518684031
k=6  |  CVI value:0.10054989078387304
k=7  |  CVI value:0.09125443657890364
k=8  |  CVI value:0.08277205774244745
k=9  |  CVI value:0.08277205774244745
k selected: 2