CVIAggregator: Combining CVIs
Here is an example using exclusively PyCVI’s pycvi.cvi.CVIAggregator in order to guess the number of clusters in a dataset. The preprocessing steps and the clustering steps can be integrated into the PyCVI pipeline by providing sklearn-like classes of clustering models (e.g. KMeans) and data preprocessor (e.g. StandardScaler).
In this example, we use non-time-series data, but the syntax would be the same for time-series data.
Here we assume that we are in real conditions, which means that we don’t have access to the true labels (except that we plot the true data for illustrative purposes). We then don’t use the features included in the pycvi.vi module.
This example showcases 2 successful clusterings and clustering selections.
If you wish to run the example scripts on your own computer, please first follow the instructions detailed in Running example scripts on your computer.
1
2import numpy as np
3import time
4from sklearn.cluster import AgglomerativeClustering, KMeans
5from sklearn.preprocessing import StandardScaler
6
7from pycvi.cluster import generate_all_clusterings, get_clustering
8from pycvi.cvi import (
9 CVIAggregator, CalinskiHarabasz, GapStatistic, Silhouette, Dunn, XB,
10)
11from pycvi.compute_scores import compute_all_scores
12from pycvi.datasets.benchmark import load_data
13from pycvi.exceptions import SelectionError
14
15from pycvi_examples_utils import plot_aggregator
16
17def pipeline(
18 cvi_aggregator,
19 X: np.ndarray,
20 y: np.ndarray,
21 model_class,
22 model_kw: dict,
23 fig_title: str = "",
24 fig_name: str = "",
25 k_max: int = 25,
26 scaler = StandardScaler(),
27) -> None:
28 """
29 This function gives an example of typical use of CVIAggregator.
30
31 In this example we assume that we are in real conditions, which
32 means that we don't have access to the true labels (except for the
33 final figure). We then don't use the features included in the
34 :mod:`pycvi.vi` module. In this function we:
35
36 - Standardize the data
37 - Generate all clusterings for a given range of number of clusters.
38 - Define a CVIAggregator that will use all CVI available in PyCVI.
39 - Compute CVI values using CVIAggregator
40 - Select the best clustering according the CVIAggregator, itself
41 - selecting the best clustering according to a majority vote on the
42 best clustering according to its individual CVI.
43 - Create a summary plot containing the true clustering, the selected
44 clustering according to the CVIAggregator and the votes of the
45 individual CVIs represented by the CVIAggregator.
46 """
47 print(f'\n ***** {fig_title} ***** \n')
48 k_range = range(k_max)
49
50 # ------------------------------------------------------------------
51 # ------------------ Define true clustering -----------------------
52 # ------------------------------------------------------------------
53 # From the label for each datapoint to a list of datapoints for each cluster.
54 # true clusters: List[List[int]]
55 true_clusters = get_clustering(y)
56 k_true = len(true_clusters)
57
58 # ------------------------------------------------------------------
59 # ------------------ Generate clusterings -------------------------
60 # ------------------------------------------------------------------
61
62 t_start = time.time()
63
64 clusterings = generate_all_clusterings(
65 X,
66 model_class,
67 model_kw=model_kw,
68 n_clusters_range = k_range,
69 ts_dist = False,
70 scaler=scaler,
71 )
72
73 t_end = time.time()
74 dt = t_end - t_start
75
76 print(f"Clusterings generated in: {dt:.2f}s")
77
78 # ------------------------------------------------------------------
79 # ------------ Compute CVI values and select k ---------------------
80 # ------------------------------------------------------------------
81 t_start = time.time()
82
83 # Compute CVI values for all clusterings
84 scores = compute_all_scores(
85 cvi_aggregator,
86 X,
87 clusterings,
88 ts_dist=False,
89 scaler=StandardScaler(),
90 )
91
92 t_end = time.time()
93 dt = t_end - t_start
94 print('Code executed in %.2f s' %(dt))
95
96 # Select k
97 try:
98 k_selected = cvi_aggregator.select(scores)
99 # If no k could be selected with this CVIAggregator don't do anything...
100 except SelectionError as e:
101 k_selected = None
102 selected_clustering = None
103 else:
104 ax_title = (
105 f'Selected clustering. k={k_selected}, with {cvi_aggregator.votes[k_selected]}/'
106 + f'{cvi_aggregator.n_cvis} votes'
107 )
108 selected_clustering = clusterings[k_selected]
109 finally:
110 print(f"Selected k: {k_selected} | True k: {k_true}")
111
112 # ------------------------------------------------------------------
113 # ----------------------- Summary plot -----------------------------
114 # ------------------------------------------------------------------
115 # For each k value, get how many CVIs voted for it (i.e. selected it)
116 votes = cvi_aggregator.votes
117 fig = plot_aggregator(X, y, selected_clustering, votes, ax_title)
118 fig.suptitle(fig_title)
119 fig.savefig(fig_name + ".png")
120
121
122
123# ------------- Using specific CVIs ------------------------
124X, y = load_data("diamond9", "barton")
125
126chosen_cvis = [GapStatistic, Silhouette, Dunn, CalinskiHarabasz, XB]
127cvi_aggregator = CVIAggregator(chosen_cvis)
128model_class = KMeans
129model_kw = {}
130
131fig_title = "KMeans and CVI aggregator with specific CVIs"
132fig_name = "aggreg-Barton_data_KMeans-specific_cvis"
133pipeline(cvi_aggregator, X, y, model_class, model_kw, fig_title, fig_name)
134
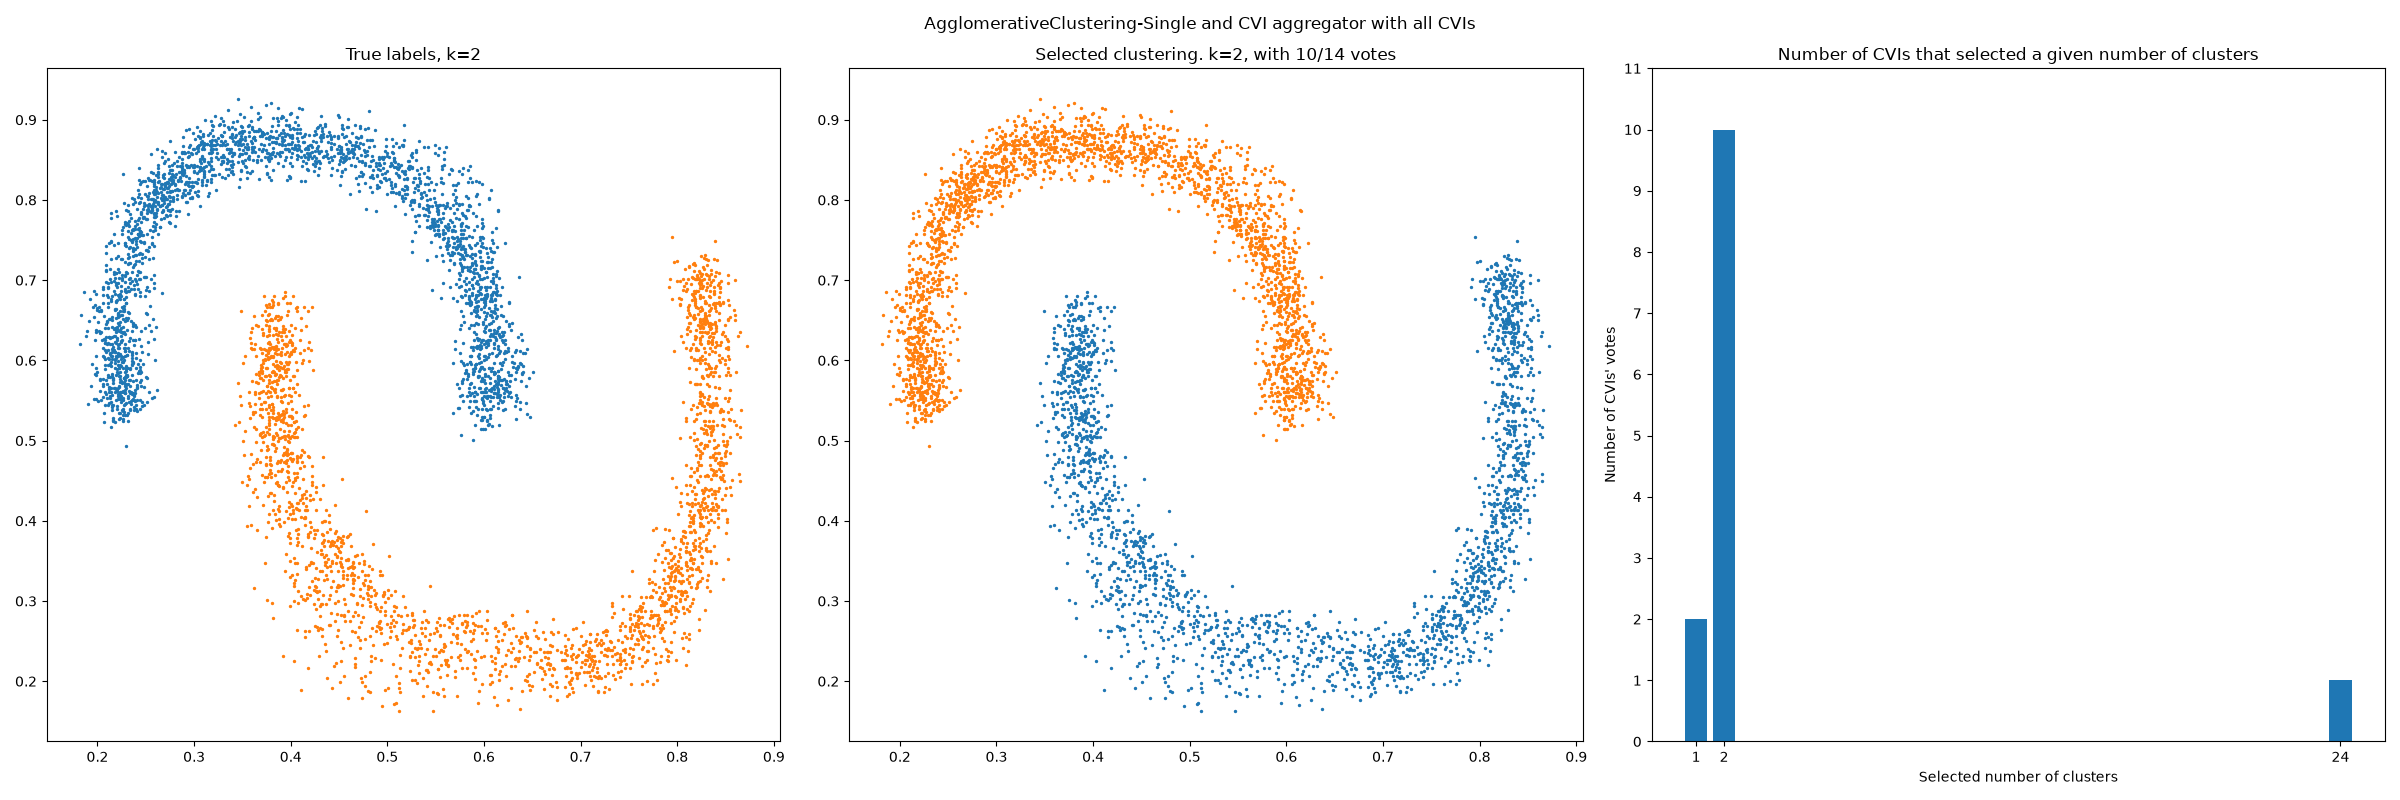
135# -------------- Using all CVIs ----------------------------
136X, y = load_data("banana", "barton")
137
138cvi_aggregator = CVIAggregator()
139model_class = AgglomerativeClustering
140# sklearn kwargs for AgglomerativeClustering
141model_kw = {"linkage" : "single"}
142
143fig_title = "AgglomerativeClustering-Single and CVI aggregator with all CVIs"
144fig_name = "aggreg-Barton_data_AgglomerativeClustering_Single-all_cvis"
145
146pipeline(cvi_aggregator, X, y, model_class, model_kw, fig_title, fig_name)
147
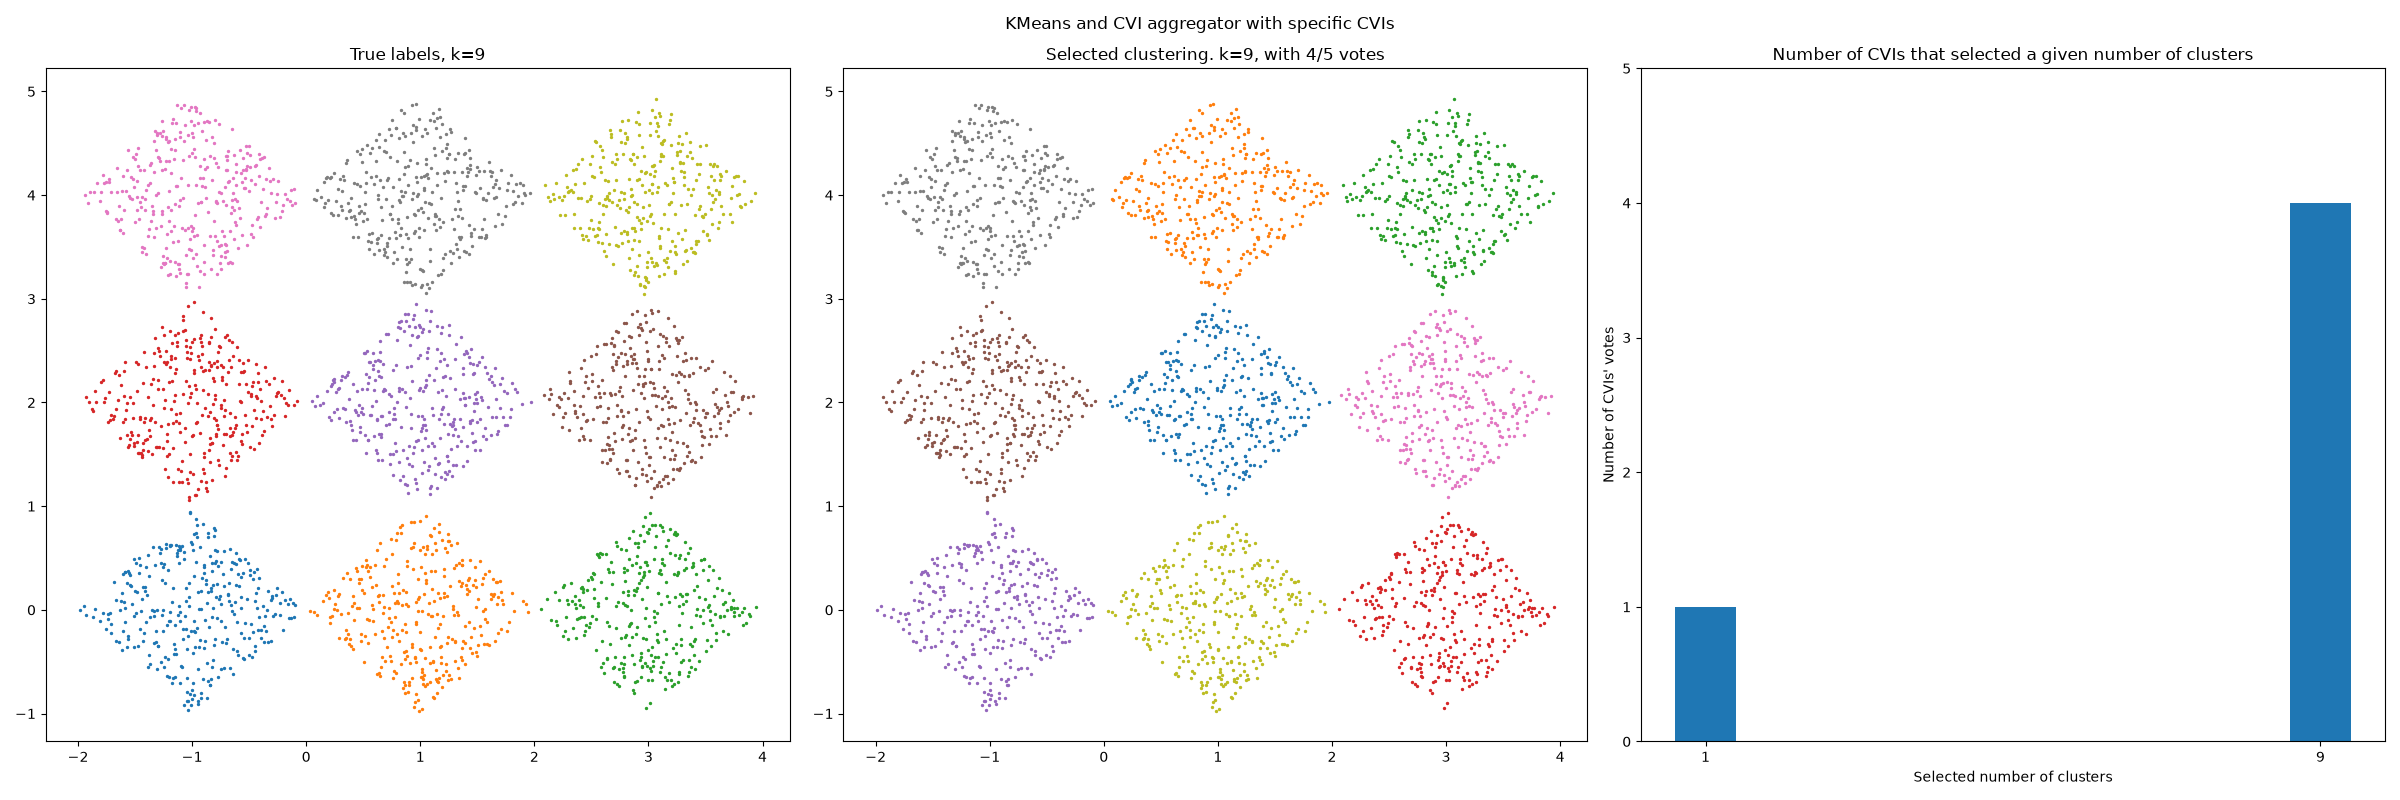
 ***** KMeans and CVI aggregator with specific CVIs *****

Clusterings generated in: 6.90s
Code executed in 38.37 s
Selected k: 9 | True k: 9

 ***** AgglomerativeClustering-Single and CVI aggregator with all CVIs *****

Clusterings generated in: 1.70s
Code executed in 80.86 s
Selected k: 2 | True k: 2