Computing cluster centers
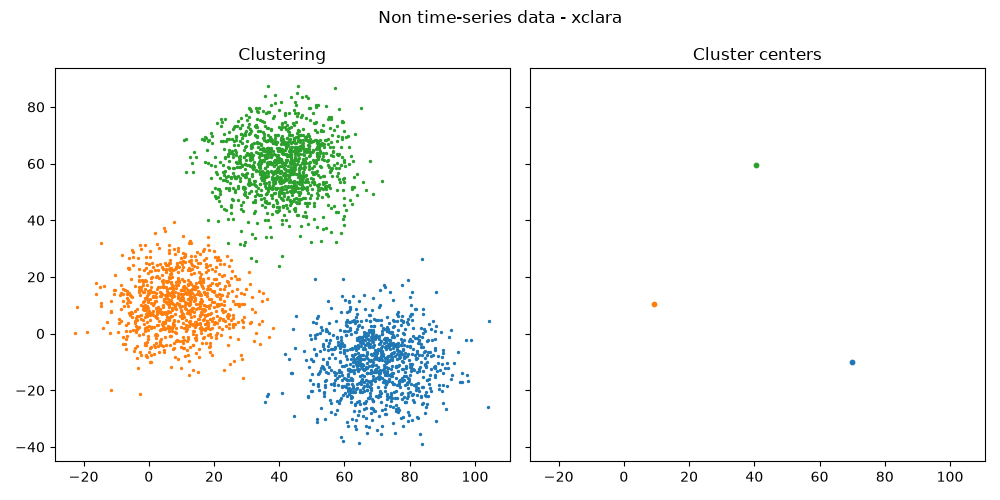
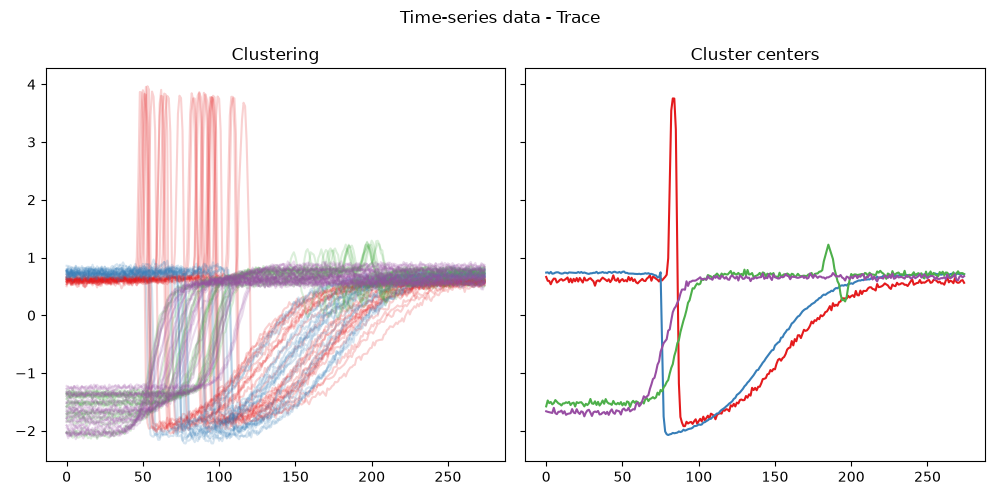
In this example, we compute the cluster centers for time series data and non time-series data and we show that from the user point of view, the approach is the same, even though PyCVI has to compute the DBA of the cluster in the time-series case.
If you wish to run the example scripts on your own computer, please first follow the instructions detailed in Running example scripts on your computer.
 1
 2from pycvi.datasets.benchmark import load_data
 3from pycvi.cluster import get_clustering, compute_centers
 4
 5from pycvi_examples_utils import plot_centers
 6
 7# ===================== Non time series-data ===========================
 8
 9data, labels = load_data("xclara", "barton")
10
11# From predicted cluster-label for each datapoint to a list of
12# datapoints for each cluster.clustering_true = get_clustering(labels)
13clustering_true = get_clustering(labels)
14
15# -------------------- Compute cluster centers -------------------------
16cluster_centers = compute_centers(data, clustering_true)
17
18# ------------------------ Summary plot --------------------------------
19fig = plot_centers(data, clustering_true, cluster_centers)
20fig_title = "Non time-series data - xclara"
21fig_name = "cluster_centers.png"
22fig.suptitle(fig_title)
23fig.savefig(fig_name)
24
25# ======================= Time series-data =============================
26
27data, labels = load_data("Trace", "ucr")
28
29# From predicted cluster-label for each datapoint to a list of
30# datapoints for each cluster.clustering_true = get_clustering(labels)
31clustering_true = get_clustering(labels)
32
33# -------------------- Compute cluster centers -------------------------
34cluster_centers = compute_centers(data, clustering_true)
35
36# ------------------------ Summary plot --------------------------------
37fig = plot_centers(data, clustering_true, cluster_centers)
38fig_title = "Time-series data - Trace"
39fig_name = "cluster_centers_TS.png"
40fig.suptitle(fig_title)
41fig.savefig(fig_name)
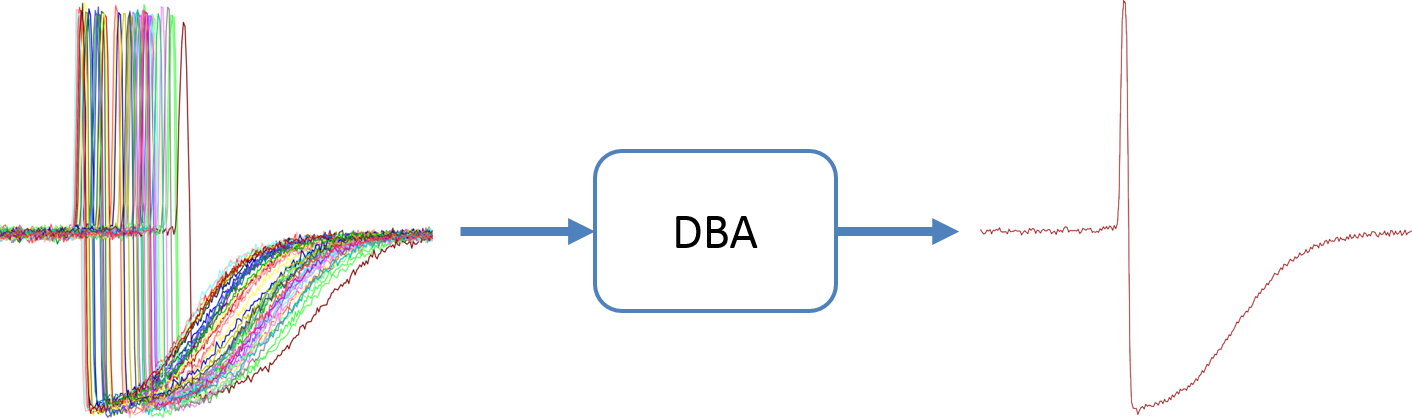
For an example showing the importance of using DBA instead of the arithmetic mean see Petitjean et al [DBA]. Below is an example from their GitHub repository:
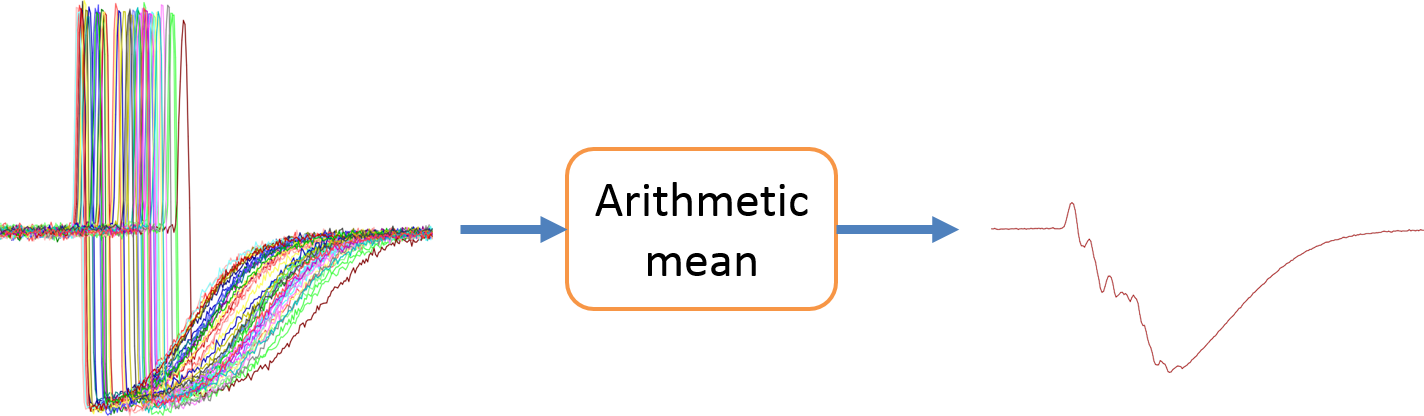
Following our example above, here are the cluster centers if we had not used DBA, but the arithmetic mean:
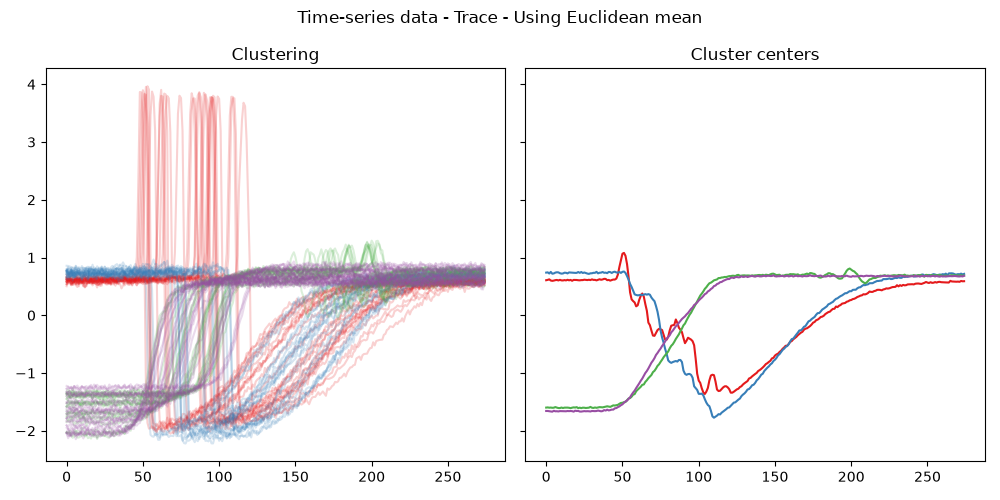
F. Petitjean, A. Ketterlin, and P. Gan carski, “A global averaging method for dynamic time warping, with applications to clustering,” Pattern Recognition, vol. 44, pp. 678–693, Mar. 2011.