Time-Series metric with Sklearn
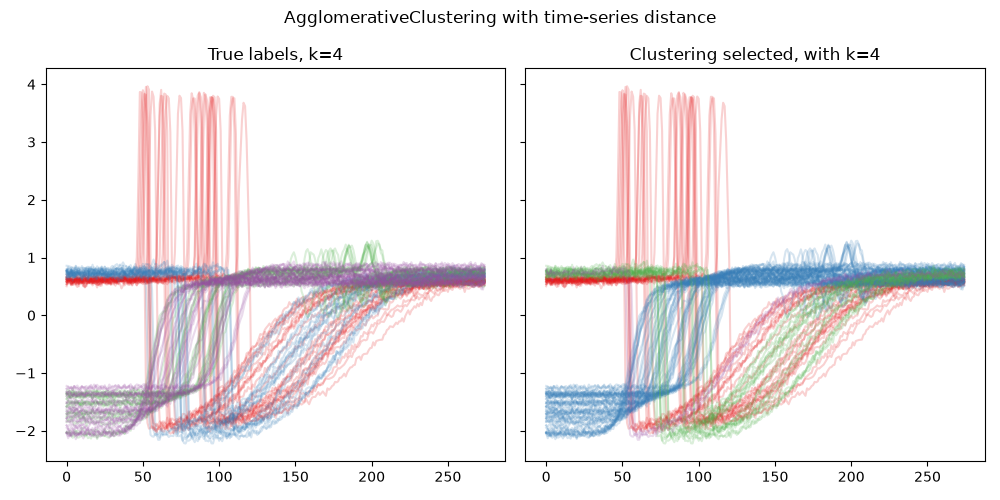
In this example, we integrate the use of a time-series metric with a scikit-learn clustering method, namely AgglomerativeClustering. This is possible thanks to PyCVI’s pycvi.dist.time_series_metric_with_sklearn() function and whenever a clustering method allows the use of a custom metric. Note that not all scikit-learn clustering method allow it, for example sklearn.cluster.KMeans doesn’t.
Combining a time-series metric with a sklearn-like model is not straightforward without PyCVI, because of the incompatible requirements on the data X for the time-series librairies and sklearn. Indeed, time-series librairies typically require the data to have a 3 dimensional shape (N, T, d) while sklearn-like models require the data to have a 2 dimensional shape (N, d). PyCVI solves this issue by reshaping the data on the fly inside the clustering model.
If you wish to run the example scripts on your own computer, please first follow the instructions detailed in Running example scripts on your computer.
 1from sklearn.cluster import AgglomerativeClustering
 2from sklearn.preprocessing import StandardScaler
 3from pycvi.datasets.benchmark import load_data
 4from pycvi.cluster import get_clustering
 5from pycvi.dist import time_series_metric_with_sklearn
 6
 7from pycvi_examples_utils import plot_true_selected
 8
 9# -------------- Standard data handling operations ---------------------
10# Load data
11data, labels = load_data("Trace", "ucr")
12(N, T, d) = data.shape
13
14# Data pre-processing
15scaler = StandardScaler()
16
17# Scaling for each variable and not time step wise
18X = scaler.fit_transform(data.reshape(N*T, d)).reshape(N, T, d)
19
20# Reshape data to match sklearn requirements
21X = data.reshape(N, T*d)
22
23# ---------- Fit a clustering model and make predictions ---------------
24# Assumed number of clusters
25k = 4
26
27# Train and predict a AgglomerativeClustering model with a Time-series metric
28model = AgglomerativeClustering(
29    n_clusters=k,
30    metric=time_series_metric_with_sklearn(X, d=d, T=T),
31    linkage="single",
32)
33
34labels_pred = model.fit_predict(X)
35
36# From predicted cluster-label for each datapoint to a list of
37# datapoints for each cluster.
38clusters_pred = get_clustering(labels_pred)
39
40# ---------------------- Summmary fig ----------------------------------
41
42clustering_true = get_clustering(labels)
43fig = plot_true_selected(data, clustering_true, clusters_pred)
44fig_title = "AgglomerativeClustering with time-series distance"
45fig_name = "ts_metric_with_sklearn_Agglo.png"
46fig.suptitle(fig_title)
47fig.savefig(fig_name)